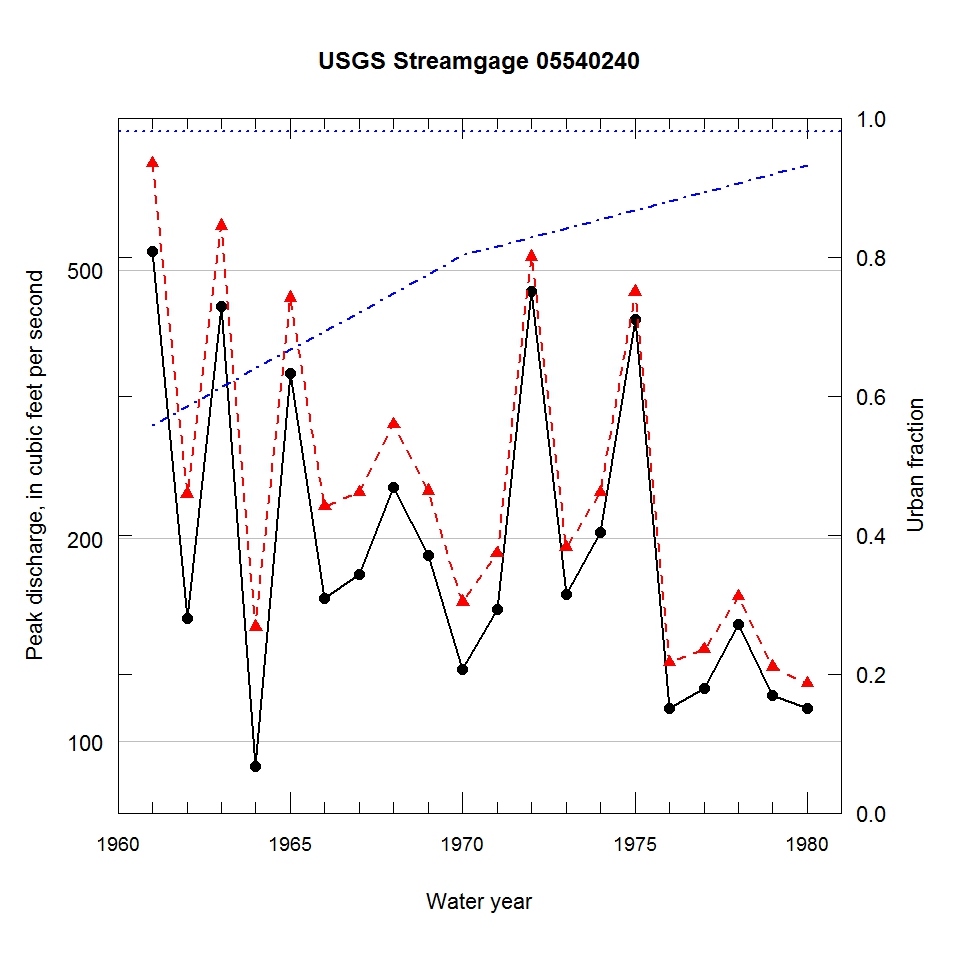
Observed and urbanization-adjusted annual maximum peak discharge and associated urban fraction and precipitation values at USGS streamgage:
05540240 PRENTISS CREEK NEAR LISLE, IL


| Water year | Segment | Discharge code | Cumulative reservoir storage (acre-feet) | Urban fraction | Precipitation (inches) | Observed peak discharge (ft3/s) | Adjusted peak discharge (ft3/s) | Exceedance probability |
| 1961 | 1 | -- | 0 | 0.557 | 1.932 | 532 | 719 | 0.008 |
| 1962 | 1 | -- | 0 | 0.584 | 0.292 | 152 | 233 | 0.402 |
| 1963 | 1 | -- | 0 | 0.612 | 1.417 | 441 | 581 | 0.016 |
| 1964 | 1 | -- | 0 | 0.639 | 3.178 | 92 | 148 | 0.824 |
| 1965 | 1 | -- | 0 | 0.666 | 1.464 | 351 | 454 | 0.037 |
| 1966 | 1 | -- | 0 | 0.694 | 3.026 | 163 | 223 | 0.446 |
| 1967 | 1 | -- | 0 | 0.721 | 1.543 | 177 | 234 | 0.397 |
| 1968 | 1 | -- | 0 | 0.748 | 3.154 | 238 | 295 | 0.182 |
| 1969 | 1 | -- | 0 | 0.776 | 1.171 | 189 | 235 | 0.390 |
| 1970 | 1 | -- | 0 | 0.803 | 1.167 | 128 | 161 | 0.761 |
| 1971 | 1 | -- | 0 | 0.816 | 0.209 | 157 | 190 | 0.604 |
| 1972 | 1 | -- | 0 | 0.829 | 3.095 | 465 | 523 | 0.021 |
| 1973 | 1 | -- | 0 | 0.841 | 0.912 | 165 | 194 | 0.586 |
| 1974 | 1 | -- | 0 | 0.854 | 1.161 | 204 | 234 | 0.400 |
| 1975 | 1 | -- | 0 | 0.867 | 2.003 | 423 | 464 | 0.034 |
| 1976 | 1 | -- | 0 | 0.880 | 0.776 | 112 | 131 | 0.900 |
| 1977 | 1 | -- | 0 | 0.893 | 1.528 | 120 | 137 | 0.875 |
| 1978 | 1 | -- | 0 | 0.906 | 1.345 | 149 | 164 | 0.748 |
| 1979 | 1 | -- | 0 | 0.919 | 1.204 | 117 | 129 | 0.907 |
| 1980 | 1 | -- | 0 | 0.932 | 1.783 | 112 | 122 | 0.930 |

